This was originally part of the Industrial report but as that became too long I decided to split this out. It is closely linked to that in some respects in that population = demand and population = input resources. I’ll start with what is quite a challenge in PoN of keeping your people happy. As was clear post-unification, widespread dissent is bad news and exceptionally hard to eradicate.
Happy people
Keeping your people happy is a simple matter of giving them what they want.
Yeah right.
Now as is probably clear, this is actually a challenge. First is the producing and buying of the goods they want and this demand increases over time. Second, a number of techs increase either the speed at which they become militant or the seriousness of the consequences when militancy rises.
This is mostly tech driven and, unlike in Victoria, in PoN you cannot decide to avoid certain techs. You can decide not to invest in them but sooner or later they will fire. There are three groups that affect how your population intersects with your economy:
- a group that increase consumption levels for each type of population;
- a group that either increases the impact of dissatisfaction on militancy (ie makes dissatisfied people more militant); or,
- makes militant people more quickly dissatisfied.
These last two are not quite the same. Some techs mean that once they are dissatisfied, they are more likely to shift to demonstrations, strikes or outright revolt. Others mean that once they are in some form of revolt, their satisfaction drops more quickly. In combination, potentially a vicious cycle.
Your only defences are ensuring you sell enough to meet their needs and passing the various decrees such as education, trades union legalisation, social security and so on that remove militancy. My instinct is that as the Nineteenth Century progresses, keeping it all in check becomes more and more difficult. You can also improve the rate of gain of contentment by lowering key taxes (but of course that makes investing in the social programmes that reduce militancy all the more difficult).
Its for these reasons I now think the Ottoman Empire is not going to recover. It clearly has a widespread revolt problem, I doubt it can buy in much, it will need to keep taxes high in an attempt to recover its fiscal position.
Population Growth
The other factor that drives consumption is population growth and population change. The former is partly organic and partly comes from playing all those development (telecommunications and sewers) cards. Now those also increase development level which is good and sometimes give small amounts of prestige. But basically population will grow, will expect more and will become more vocal if these needs are not met.
We’ll start with the reports you are used to seeing. Main issue here is some return of militancy but I think this is connected with recent techs (anarchism, Paris Commune) that have fired rather than any underlying cause. What this does show is the way that I am in a bit of a race to discover population pleasing techs (or run my economy on that basis) set against the social and political developments of the Nineteenth Century.
Also, frequently playing cards around education and so on all help to control the situation (& all cost state money).
Any major flaw in an economy is going to quickly produce substantial unrest.
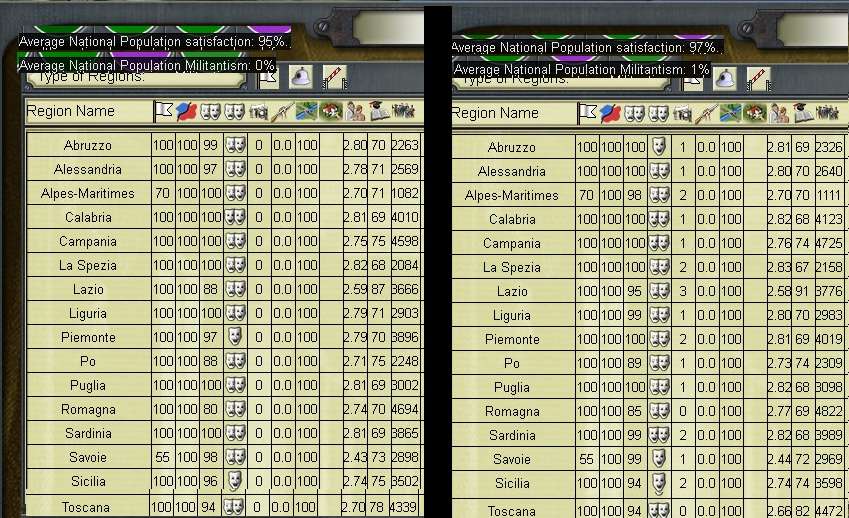
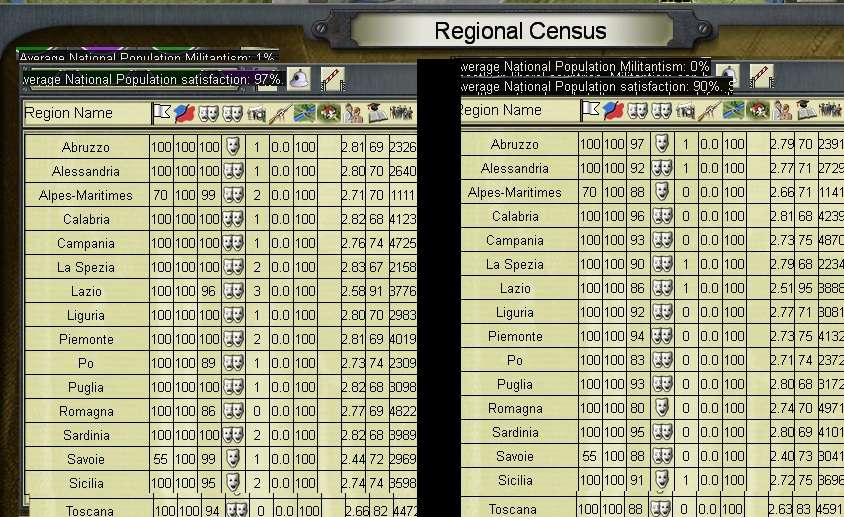
I’m going to do two views on the population table (and compare them to the situation in September 1864 when unification occurred). The first is the table you are used to looking at that shows population and happiness. The key measure is back then, contentment was 53% and militancy was 13% (now 85% and 2%).

Now this (to me … but then I love this sort of stuff), is rather interesting.
As you can see, all those sewers and telecommunications mean that Italy is now all at development level 100 (apart from Lazio) compared to in the 80-90 range on unification. [color="#FF0000"]edit - Equally the rate of population growth (final column) has increased. So for example Sicilia was 1.58 on unification and is now 2.34. In general, the rate of population expansion is up 50% since unification.[/color]
Now lets look at the side of this table I’ve tended not to report on as it shows how the make up of that population has varied (again Tuscany is missing from 1864).

Average education has actually not increased that much. I’m not too sure why but it may be the consequence of population growth against whatever outcome my (fixed) social system produces?
The actual shifts in population detail are quite complex. The manual talks about shifts in social class and so on but to me that looks mostly like the same ratios in 1873 as in 1864, just more people at every social class.
There is other information that I have been usually not reporting. These summarise contentment, militancy, population type (Italy is still 66% peasants), ethnicity (within Italy only the French minorities in Savoy and the Alpes Maritimes) and notional religion.

Population Growth and Change
There are three population change mechanisms that happen mostly out of your control. Within a province, population will move from countryside to urban (so shift from farmers to industrial labourers), population will move to different social groups (education plays a role here) and population will move locally if there is unemployment in one province and work in another. All these rather happen out of your control but my assumption is if you do sensible things then predictable outcomes will happen. Long range migration (unlike in Victoria) only happens by event (there is one that moves population to N America for example), again out of your control.
In addition, population increase can be triggered by playing the two development cards I currently have – telecommunications and sewers.
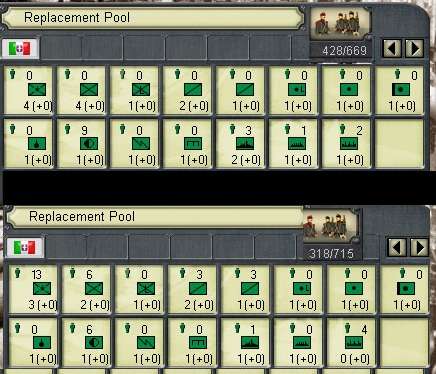
The next bit of population information is demand for the three classes of goods – food, common, luxury. These vary by social class and are increased for all classes as certain techs are fired. Obviously, total population then, in turn, influences total demand.
Thing to note here is that the more individual items you supply the more positive the impact. There is a limit to how much anyone good can supply in any case, but for example, if you supply most of the food goods that is better than just fish and cereals.

So at the moment, as discussed in the economy report, I am meeting my demands in all but the luxury goods aspect, and bringing on line those gems and the remaining opium will help
So demand for all goods by all social classes has increased. What you see is the combination of base rate population gain (as discussed above around 50% for each social class) and of the demand increasing techs that I have reported as they fire. So the demand by peasants for luxuries has doubled, my guess is the move from 8-12 is population related (ie there are more of them) and from 12-15 is tech related (they now expect more).
Population at the province level.
Those of you used to Victoria are also perhaps used to looking at the population by province (and of course in V1 the joys of ‘pop-splitting’). One claim in the PoN manual is that if you site too much or too little industrial activity it will be less efficient. Well I’ll be honest and say I can’t find any evidence for this, as an eg lets look at an ammunition plant in Taranto compared to one in Piedmont.

So I’ll file that one under ‘unproven’. Its clear that development level has a real impact as does the presence (or lack) of railway lines, but I am not sure the attempt to model industrial density actually works.
On that basis, its not really clear why you would want to dig deep into the province population model when making location decisions. If you do, then it is not easy, as I’ll try to show.
I’ll use Piedmonte as my example as it is a well developed industrial centre.

This summarises the situation. It is a level 9 city, with a population about 55% rural 45% urban (so this is high for Italy) and has a lot of production (which makes sense as it was the focus of my development when I was just Sardinia-Piedmont).
Now we can work out if I have unemployment. Or at least try:

Yep, you need to check every factory etc, and it’s not easy.

Which I think tells us very little. Its not quite a black box model, not least you can see a lot of information, but its clearly not one you are designed to interact with or use.
The only clear message there is it seems as if a basic factory employs 65 people, one with the first upgrade 85 and I guess so on. Equally a base agricultural site employs 20, an upgrade 30. But then in turn, as you start the upgrade path it makes sense to concentrate on a few and let others lag.
So that is another update you really don’t need to read to follow the AAR. In truth, either by design, or due to how the information is presented, the population dynamics in PoN are rather opaque and feel mostly out of your control. Its one of the ways in which PoN varies from Victoria.

 o
o


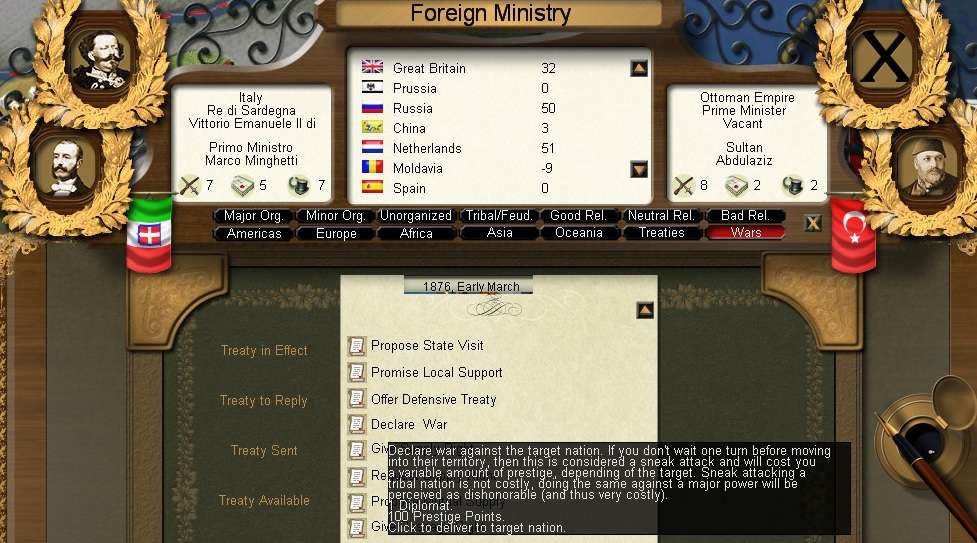
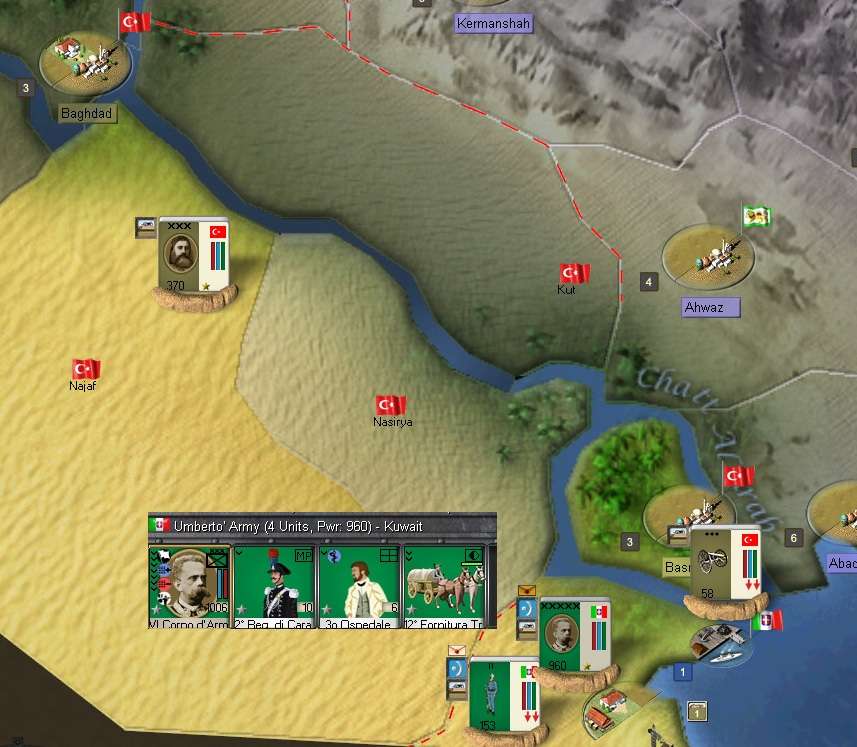
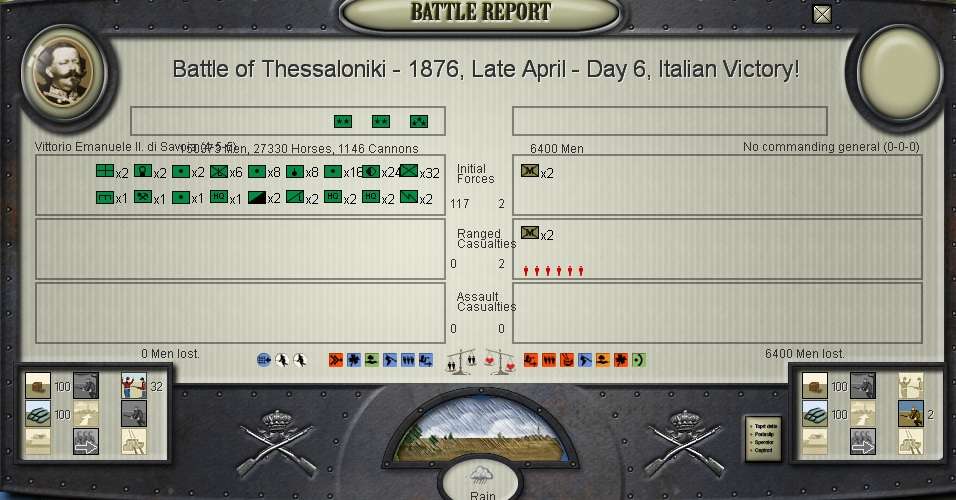
 On the Otto war itself, I agree with the timing, since it appears that you and Russia made short work of them and it should not take long for other parties to sense the smell of blood :/


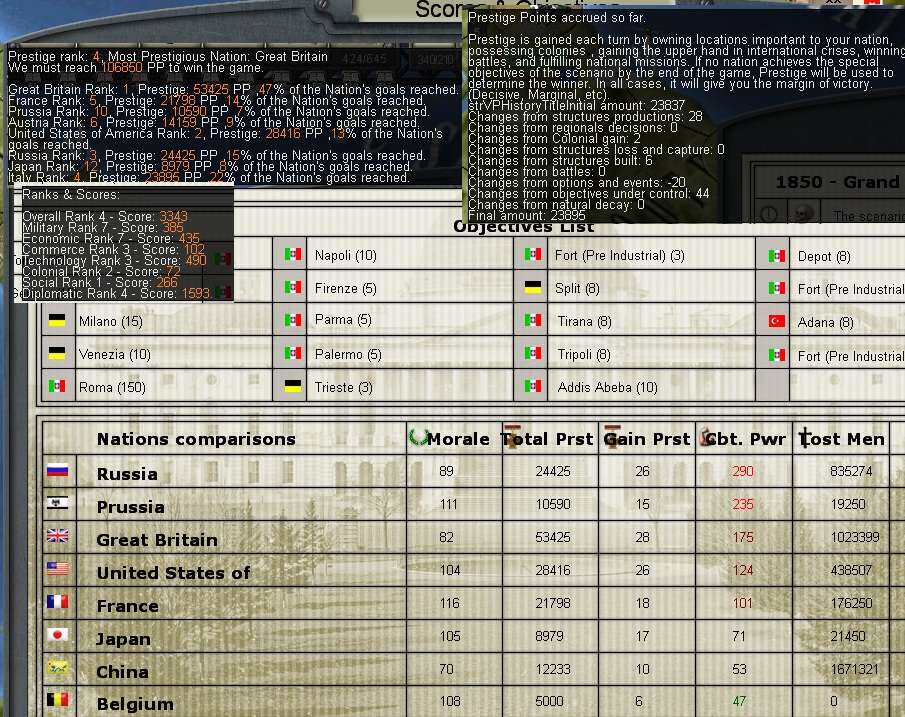


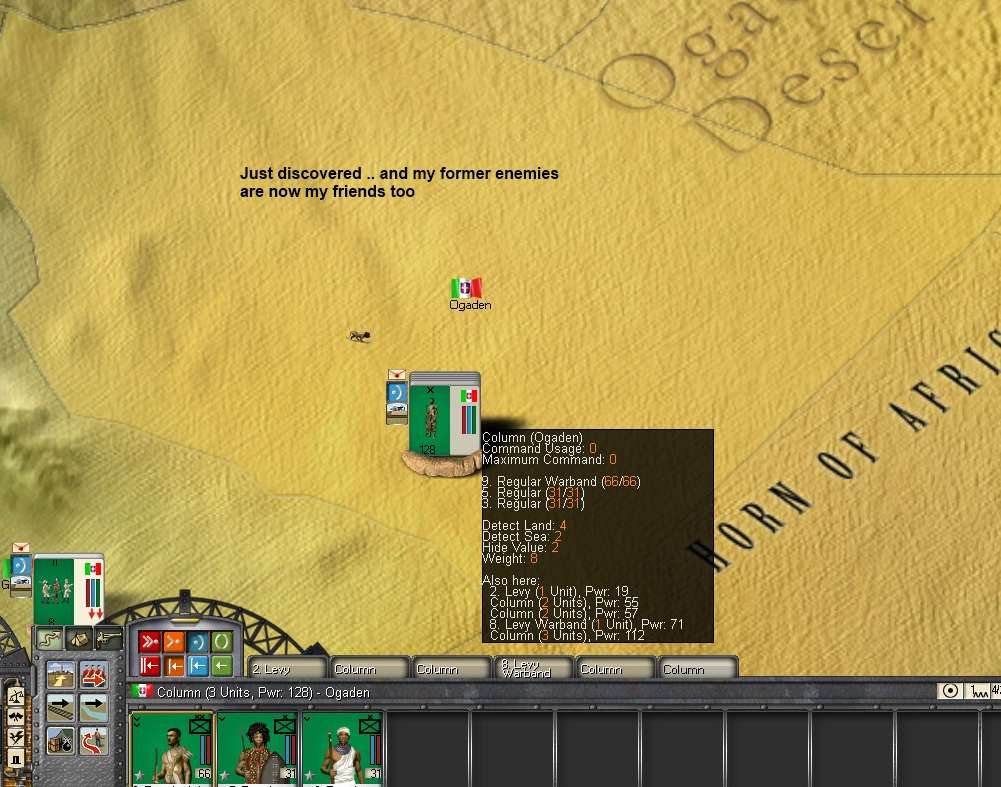
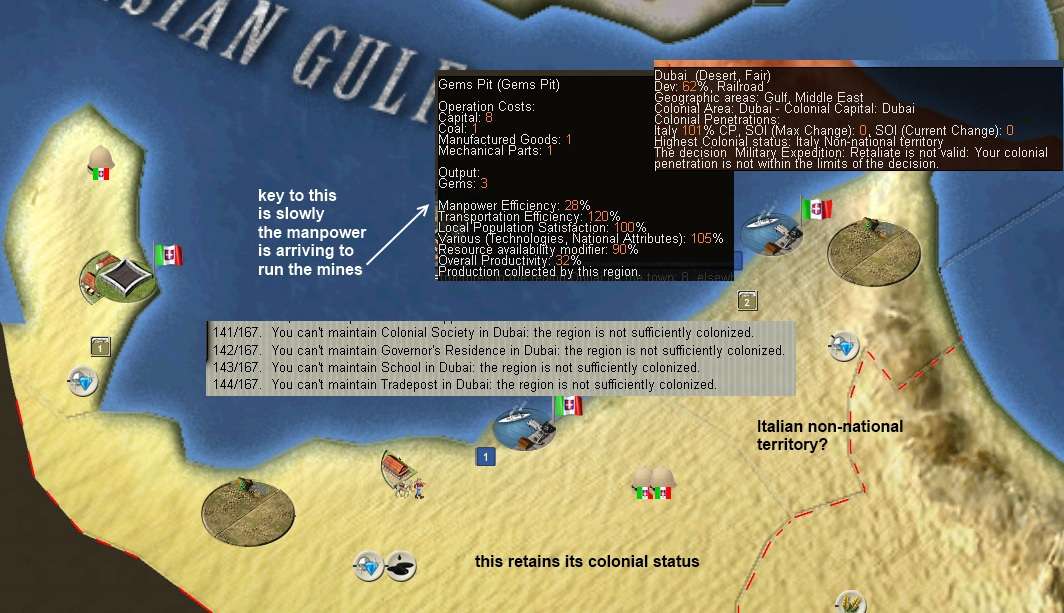
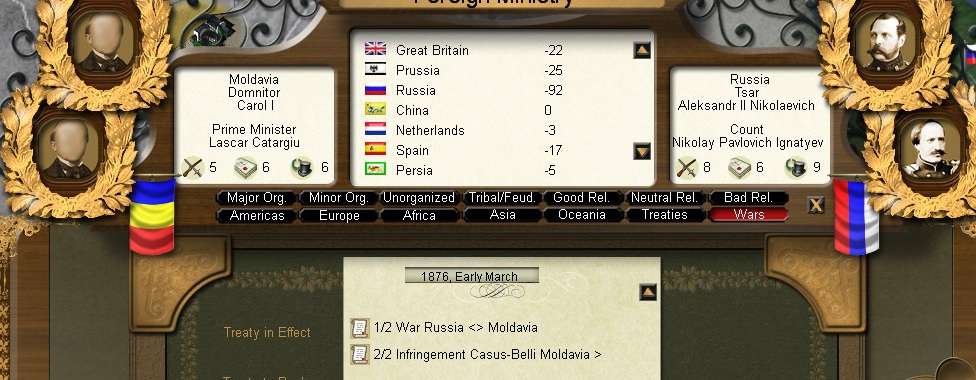

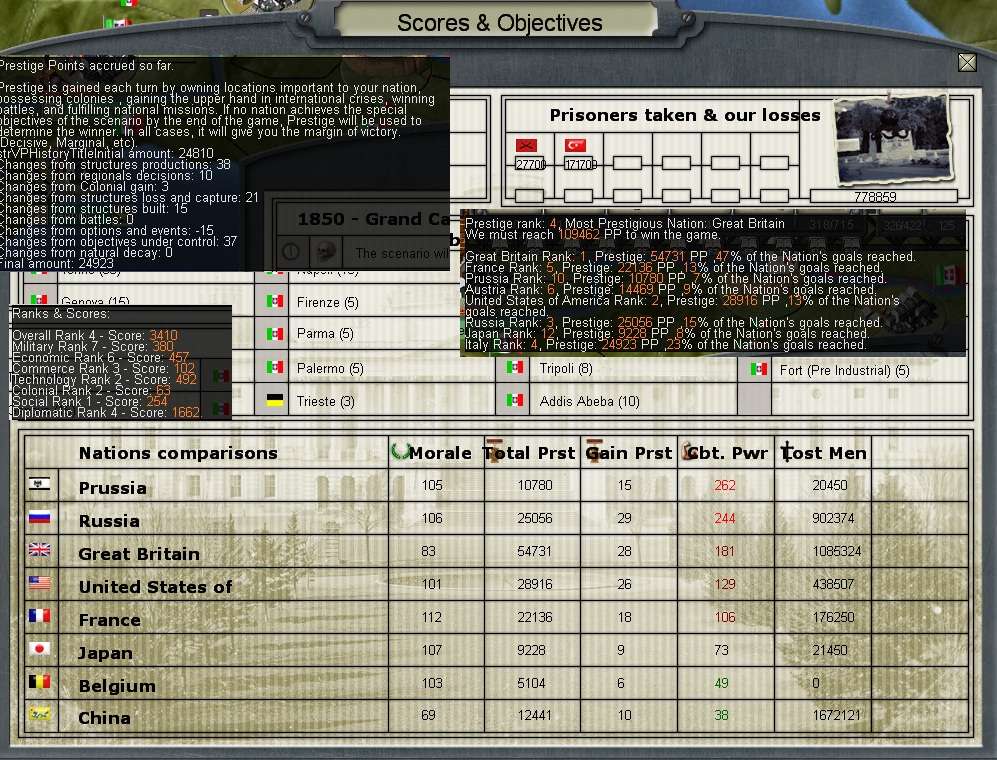






 . Now I think they are losing their war with the Prussians (judging by the respective NMs) so in a way that helps me too ...


